anti mouse cd4 antibody Search Results


95
Miltenyi Biotec mouse cd4 miltenyi biotec
Mouse Cd4 Miltenyi Biotec, supplied by Miltenyi Biotec, used in various techniques. Bioz Stars score: 95/100, based on 1 PubMed citations. ZERO BIAS - scores, article reviews, protocol conditions and more
https://www.bioz.com/result/mouse cd4 miltenyi biotec/product/Miltenyi Biotec
Average 95 stars, based on 1 article reviews
mouse cd4 miltenyi biotec - by Bioz Stars, 2026-06
95/100 stars
  Buy from Supplier

96
Miltenyi Biotec cd4 biotin
Cd4 Biotin, supplied by Miltenyi Biotec, used in various techniques. Bioz Stars score: 96/100, based on 1 PubMed citations. ZERO BIAS - scores, article reviews, protocol conditions and more
https://www.bioz.com/result/cd4 biotin/product/Miltenyi Biotec
Average 96 stars, based on 1 article reviews
cd4 biotin - by Bioz Stars, 2026-06
96/100 stars
  Buy from Supplier

95
Elabscience Biotechnology fluorescein isothiocyanate fitc anti mouse cd4
Fluorescein Isothiocyanate Fitc Anti Mouse Cd4, supplied by Elabscience Biotechnology, used in various techniques. Bioz Stars score: 95/100, based on 1 PubMed citations. ZERO BIAS - scores, article reviews, protocol conditions and more
https://www.bioz.com/result/fluorescein isothiocyanate fitc anti mouse cd4/product/Elabscience Biotechnology
Average 95 stars, based on 1 article reviews
fluorescein isothiocyanate fitc anti mouse cd4 - by Bioz Stars, 2026-06
95/100 stars
  Buy from Supplier

94
Elabscience Biotechnology apc anti mouse cd4
Evaluation of antitumor immune responses and biosafety evaluation. (A) FCM analysis and quantitative analysis of (B) <t>CD4</t> + T cells and (C) CD8 + T cells in tumor tissues. The levels of (D) IL-6, (E) IFN-γ and (F) TNF-α in the serum of mice quantified by ELISA at the end of treatment. (G) Body weight of mice after various treatments (n = 4). (H) H&E staining of the major organs (heart, liver, spleen, lung and kidney) of mice after various treatments (Scale bars: 100 μm). Data are presented as mean ± SD (ns, not significant, ∗p < 0.05, ∗∗p < 0.01, ∗∗∗p < 0.001, ∗∗∗∗p < 0.0001).
Apc Anti Mouse Cd4, supplied by Elabscience Biotechnology, used in various techniques. Bioz Stars score: 94/100, based on 1 PubMed citations. ZERO BIAS - scores, article reviews, protocol conditions and more
https://www.bioz.com/result/apc anti mouse cd4/product/Elabscience Biotechnology
Average 94 stars, based on 1 article reviews
apc anti mouse cd4 - by Bioz Stars, 2026-06
94/100 stars
  Buy from Supplier

94
Elabscience Biotechnology cd4 pe
Evaluation of antitumor immune responses and biosafety evaluation. (A) FCM analysis and quantitative analysis of (B) <t>CD4</t> + T cells and (C) CD8 + T cells in tumor tissues. The levels of (D) IL-6, (E) IFN-γ and (F) TNF-α in the serum of mice quantified by ELISA at the end of treatment. (G) Body weight of mice after various treatments (n = 4). (H) H&E staining of the major organs (heart, liver, spleen, lung and kidney) of mice after various treatments (Scale bars: 100 μm). Data are presented as mean ± SD (ns, not significant, ∗p < 0.05, ∗∗p < 0.01, ∗∗∗p < 0.001, ∗∗∗∗p < 0.0001).
Cd4 Pe, supplied by Elabscience Biotechnology, used in various techniques. Bioz Stars score: 94/100, based on 1 PubMed citations. ZERO BIAS - scores, article reviews, protocol conditions and more
https://www.bioz.com/result/cd4 pe/product/Elabscience Biotechnology
Average 94 stars, based on 1 article reviews
cd4 pe - by Bioz Stars, 2026-06
94/100 stars
  Buy from Supplier

93
Elabscience Biotechnology violet 450 anti mouse cd4 antibody
Evaluation of antitumor immune responses and biosafety evaluation. (A) FCM analysis and quantitative analysis of (B) <t>CD4</t> + T cells and (C) CD8 + T cells in tumor tissues. The levels of (D) IL-6, (E) IFN-γ and (F) TNF-α in the serum of mice quantified by ELISA at the end of treatment. (G) Body weight of mice after various treatments (n = 4). (H) H&E staining of the major organs (heart, liver, spleen, lung and kidney) of mice after various treatments (Scale bars: 100 μm). Data are presented as mean ± SD (ns, not significant, ∗p < 0.05, ∗∗p < 0.01, ∗∗∗p < 0.001, ∗∗∗∗p < 0.0001).
Violet 450 Anti Mouse Cd4 Antibody, supplied by Elabscience Biotechnology, used in various techniques. Bioz Stars score: 93/100, based on 1 PubMed citations. ZERO BIAS - scores, article reviews, protocol conditions and more
https://www.bioz.com/result/violet 450 anti mouse cd4 antibody/product/Elabscience Biotechnology
Average 93 stars, based on 1 article reviews
violet 450 anti mouse cd4 antibody - by Bioz Stars, 2026-06
93/100 stars
  Buy from Supplier

94
Elabscience Biotechnology pe cyanine7 anti mouse cd4 antibody
Fig. 9. Mechanistic analysis of PB nanozymes and PBVac for cancer therapy. Representative flow-cytograms and quantitative analysis of (A) <t>CD3+CD4+</t> T cells and (B) CD3+CD8+ T cells in the tumors. Data are the mean ± SD (n = 3). *P < 0.05; **P < 0.01; ***P < 0.001; n. s. (not significant).
Pe Cyanine7 Anti Mouse Cd4 Antibody, supplied by Elabscience Biotechnology, used in various techniques. Bioz Stars score: 94/100, based on 1 PubMed citations. ZERO BIAS - scores, article reviews, protocol conditions and more
https://www.bioz.com/result/pe cyanine7 anti mouse cd4 antibody/product/Elabscience Biotechnology
Average 94 stars, based on 1 article reviews
pe cyanine7 anti mouse cd4 antibody - by Bioz Stars, 2026-06
94/100 stars
  Buy from Supplier

94
Elabscience Biotechnology anti cd4 pc5 5
Fig. 9. Mechanistic analysis of PB nanozymes and PBVac for cancer therapy. Representative flow-cytograms and quantitative analysis of (A) <t>CD3+CD4+</t> T cells and (B) CD3+CD8+ T cells in the tumors. Data are the mean ± SD (n = 3). *P < 0.05; **P < 0.01; ***P < 0.001; n. s. (not significant).
Anti Cd4 Pc5 5, supplied by Elabscience Biotechnology, used in various techniques. Bioz Stars score: 94/100, based on 1 PubMed citations. ZERO BIAS - scores, article reviews, protocol conditions and more
https://www.bioz.com/result/anti cd4 pc5 5/product/Elabscience Biotechnology
Average 94 stars, based on 1 article reviews
anti cd4 pc5 5 - by Bioz Stars, 2026-06
94/100 stars
  Buy from Supplier

93
Elabscience Biotechnology anti cd4
Fig. 9. Mechanistic analysis of PB nanozymes and PBVac for cancer therapy. Representative flow-cytograms and quantitative analysis of (A) <t>CD3+CD4+</t> T cells and (B) CD3+CD8+ T cells in the tumors. Data are the mean ± SD (n = 3). *P < 0.05; **P < 0.01; ***P < 0.001; n. s. (not significant).
Anti Cd4, supplied by Elabscience Biotechnology, used in various techniques. Bioz Stars score: 93/100, based on 1 PubMed citations. ZERO BIAS - scores, article reviews, protocol conditions and more
https://www.bioz.com/result/anti cd4/product/Elabscience Biotechnology
Average 93 stars, based on 1 article reviews
anti cd4 - by Bioz Stars, 2026-06
93/100 stars
  Buy from Supplier

94
Miltenyi Biotec cd4 apc
a. Spleen weight of wild-type (WT) and Ftx KO females at 3-months, 1-year and 2-years of age. Median values are shown. ( t-test , * p -values < 0.05). Underneath, representative images of WT and Ftx KO spleens from 3-month, 1-year and 2-year-old females. b. Representative images of hematoxylin-eosin staining on sections of spleens from 1-year-old WT and Ftx KO females. Scale bar; 100 μm. c. Representative flow cytometry analysis of splenic myeloid dendritic cells (m-DC) in WT and Ftx KO 1-year-old females. On the right, percentages of splenic m-DC (CD11b + CD11c + ) and splenic plasmacytoid dendritic cells (p-DC) (CD11c + B220 + SiglecH + ) in leucocytes. Each triangle represents a mouse. Median values are shown. ( t-test , * p -values < 0.05). d. Representative flow cytometry analysis of spontaneously activated B cells (B220 + CD69 + ) (upper panels) or of spontaneously activated T cells <t>(CD4</t> + CD69 + ) (lower panels) in spleen from 1-year-old WT and Ftx KO females. Percentages in leucocytes are shown on the graphs beneath. Each triangle represents a mouse. Median values are shown. ( t-test , * p -values < 0.05). e. IgG2a natural antibody levels in sera of 1-year- and 2-year-old WT or Ftx KO females measured by ELISA. Each triangle represents a mouse. Median values are shown. ( t-test , * p -values < 0.05). f. Representative flow cytometry analysis of (B220 + CD138 + ) plasma cells in the spleen of 1-year-old WT and Ftx KO females. Percentages in leucocytes are shown on the graphs beneath. Each triangle represents a mouse. Median values are shown. ( t-test , * p -values < 0.05). g. Representative flow cytometry analysis of (CD19 + B220 lo CD5 + ) natural antibody producing B1a in the peritoneal cavity (PerC) of 1-year-old WT and Ftx KO females. Percentages in leucocytes are shown on the graphs beneath. Each triangle represents a mouse. Median values are shown. ( t-test , * p -values < 0.05). h. Cytokines levels in the blood analysed with CBA assays on sera from 3-month-, 1-year-, or 2-year-old WT and Ftx KO females. Each triangle represents a mouse. Median values are shown. ( t-test , * p -values < 0.05). i. Representative flow cytometry analysis of monocyte populations including non-classical (CD11b hi CD43 lo Ly6C + ) scavenger monocytes in the spleen of 1-year-old WT and Ftx KO females. Percentages in leucocytes are shown on the graphs beneath. Each triangle represents a mouse. Median values are shown. ( t-test , * p -values < 0.05).
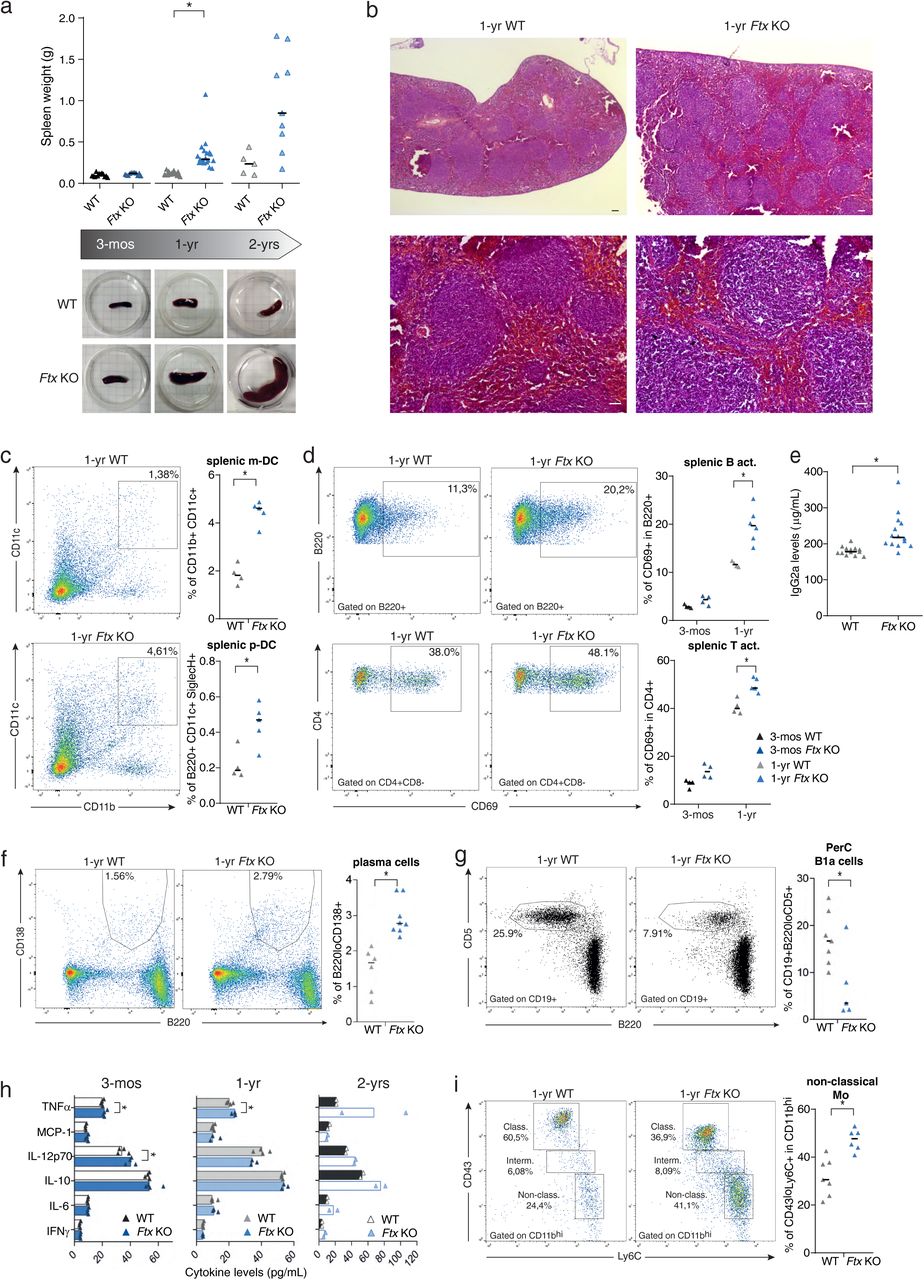
Cd4 Apc, supplied by Miltenyi Biotec, used in various techniques. Bioz Stars score: 94/100, based on 1 PubMed citations. ZERO BIAS - scores, article reviews, protocol conditions and more
https://www.bioz.com/result/cd4 apc/product/Miltenyi Biotec
Average 94 stars, based on 1 article reviews
cd4 apc - by Bioz Stars, 2026-06
94/100 stars
  Buy from Supplier

93
Elabscience Biotechnology cd4
a. Spleen weight of wild-type (WT) and Ftx KO females at 3-months, 1-year and 2-years of age. Median values are shown. ( t-test , * p -values < 0.05). Underneath, representative images of WT and Ftx KO spleens from 3-month, 1-year and 2-year-old females. b. Representative images of hematoxylin-eosin staining on sections of spleens from 1-year-old WT and Ftx KO females. Scale bar; 100 μm. c. Representative flow cytometry analysis of splenic myeloid dendritic cells (m-DC) in WT and Ftx KO 1-year-old females. On the right, percentages of splenic m-DC (CD11b + CD11c + ) and splenic plasmacytoid dendritic cells (p-DC) (CD11c + B220 + SiglecH + ) in leucocytes. Each triangle represents a mouse. Median values are shown. ( t-test , * p -values < 0.05). d. Representative flow cytometry analysis of spontaneously activated B cells (B220 + CD69 + ) (upper panels) or of spontaneously activated T cells <t>(CD4</t> + CD69 + ) (lower panels) in spleen from 1-year-old WT and Ftx KO females. Percentages in leucocytes are shown on the graphs beneath. Each triangle represents a mouse. Median values are shown. ( t-test , * p -values < 0.05). e. IgG2a natural antibody levels in sera of 1-year- and 2-year-old WT or Ftx KO females measured by ELISA. Each triangle represents a mouse. Median values are shown. ( t-test , * p -values < 0.05). f. Representative flow cytometry analysis of (B220 + CD138 + ) plasma cells in the spleen of 1-year-old WT and Ftx KO females. Percentages in leucocytes are shown on the graphs beneath. Each triangle represents a mouse. Median values are shown. ( t-test , * p -values < 0.05). g. Representative flow cytometry analysis of (CD19 + B220 lo CD5 + ) natural antibody producing B1a in the peritoneal cavity (PerC) of 1-year-old WT and Ftx KO females. Percentages in leucocytes are shown on the graphs beneath. Each triangle represents a mouse. Median values are shown. ( t-test , * p -values < 0.05). h. Cytokines levels in the blood analysed with CBA assays on sera from 3-month-, 1-year-, or 2-year-old WT and Ftx KO females. Each triangle represents a mouse. Median values are shown. ( t-test , * p -values < 0.05). i. Representative flow cytometry analysis of monocyte populations including non-classical (CD11b hi CD43 lo Ly6C + ) scavenger monocytes in the spleen of 1-year-old WT and Ftx KO females. Percentages in leucocytes are shown on the graphs beneath. Each triangle represents a mouse. Median values are shown. ( t-test , * p -values < 0.05).
Cd4, supplied by Elabscience Biotechnology, used in various techniques. Bioz Stars score: 93/100, based on 1 PubMed citations. ZERO BIAS - scores, article reviews, protocol conditions and more
https://www.bioz.com/result/cd4/product/Elabscience Biotechnology
Average 93 stars, based on 1 article reviews
cd4 - by Bioz Stars, 2026-06
93/100 stars
  Buy from Supplier

92
Elabscience Biotechnology wuhan elabscience biotechnology co
a. Spleen weight of wild-type (WT) and Ftx KO females at 3-months, 1-year and 2-years of age. Median values are shown. ( t-test , * p -values < 0.05). Underneath, representative images of WT and Ftx KO spleens from 3-month, 1-year and 2-year-old females. b. Representative images of hematoxylin-eosin staining on sections of spleens from 1-year-old WT and Ftx KO females. Scale bar; 100 μm. c. Representative flow cytometry analysis of splenic myeloid dendritic cells (m-DC) in WT and Ftx KO 1-year-old females. On the right, percentages of splenic m-DC (CD11b + CD11c + ) and splenic plasmacytoid dendritic cells (p-DC) (CD11c + B220 + SiglecH + ) in leucocytes. Each triangle represents a mouse. Median values are shown. ( t-test , * p -values < 0.05). d. Representative flow cytometry analysis of spontaneously activated B cells (B220 + CD69 + ) (upper panels) or of spontaneously activated T cells <t>(CD4</t> + CD69 + ) (lower panels) in spleen from 1-year-old WT and Ftx KO females. Percentages in leucocytes are shown on the graphs beneath. Each triangle represents a mouse. Median values are shown. ( t-test , * p -values < 0.05). e. IgG2a natural antibody levels in sera of 1-year- and 2-year-old WT or Ftx KO females measured by ELISA. Each triangle represents a mouse. Median values are shown. ( t-test , * p -values < 0.05). f. Representative flow cytometry analysis of (B220 + CD138 + ) plasma cells in the spleen of 1-year-old WT and Ftx KO females. Percentages in leucocytes are shown on the graphs beneath. Each triangle represents a mouse. Median values are shown. ( t-test , * p -values < 0.05). g. Representative flow cytometry analysis of (CD19 + B220 lo CD5 + ) natural antibody producing B1a in the peritoneal cavity (PerC) of 1-year-old WT and Ftx KO females. Percentages in leucocytes are shown on the graphs beneath. Each triangle represents a mouse. Median values are shown. ( t-test , * p -values < 0.05). h. Cytokines levels in the blood analysed with CBA assays on sera from 3-month-, 1-year-, or 2-year-old WT and Ftx KO females. Each triangle represents a mouse. Median values are shown. ( t-test , * p -values < 0.05). i. Representative flow cytometry analysis of monocyte populations including non-classical (CD11b hi CD43 lo Ly6C + ) scavenger monocytes in the spleen of 1-year-old WT and Ftx KO females. Percentages in leucocytes are shown on the graphs beneath. Each triangle represents a mouse. Median values are shown. ( t-test , * p -values < 0.05).
Wuhan Elabscience Biotechnology Co, supplied by Elabscience Biotechnology, used in various techniques. Bioz Stars score: 92/100, based on 1 PubMed citations. ZERO BIAS - scores, article reviews, protocol conditions and more
https://www.bioz.com/result/wuhan elabscience biotechnology co/product/Elabscience Biotechnology
Average 92 stars, based on 1 article reviews
wuhan elabscience biotechnology co - by Bioz Stars, 2026-06
92/100 stars
  Buy from Supplier

Image Search Results


Evaluation of antitumor immune responses and biosafety evaluation. (A) FCM analysis and quantitative analysis of (B) CD4 + T cells and (C) CD8 + T cells in tumor tissues. The levels of (D) IL-6, (E) IFN-γ and (F) TNF-α in the serum of mice quantified by ELISA at the end of treatment. (G) Body weight of mice after various treatments (n = 4). (H) H&E staining of the major organs (heart, liver, spleen, lung and kidney) of mice after various treatments (Scale bars: 100 μm). Data are presented as mean ± SD (ns, not significant, ∗p < 0.05, ∗∗p < 0.01, ∗∗∗p < 0.001, ∗∗∗∗p < 0.0001).

Journal: Materials Today Bio

Article Title: A smart all-in-one strategy based on hybrid bacteria with targeting drug delivery and spatiotemporal drug release to boost the synergistic therapeutic efficacy against TNBC

doi: 10.1016/j.mtbio.2025.101849

Figure Lengend Snippet: Evaluation of antitumor immune responses and biosafety evaluation. (A) FCM analysis and quantitative analysis of (B) CD4 + T cells and (C) CD8 + T cells in tumor tissues. The levels of (D) IL-6, (E) IFN-γ and (F) TNF-α in the serum of mice quantified by ELISA at the end of treatment. (G) Body weight of mice after various treatments (n = 4). (H) H&E staining of the major organs (heart, liver, spleen, lung and kidney) of mice after various treatments (Scale bars: 100 μm). Data are presented as mean ± SD (ns, not significant, ∗p < 0.05, ∗∗p < 0.01, ∗∗∗p < 0.001, ∗∗∗∗p < 0.0001).

Article Snippet: Cell counting kit-8 (CCK-8), PE Anti-mouse CD3, FITC Anti-mouse CD8a and APC Anti-mouse CD4 were obtained from Elabscience Biotechnology Co., Ltd (Wuhan, China).

Techniques: Enzyme-linked Immunosorbent Assay, Staining

Fig. 9. Mechanistic analysis of PB nanozymes and PBVac for cancer therapy. Representative flow-cytograms and quantitative analysis of (A) CD3+CD4+ T cells and (B) CD3+CD8+ T cells in the tumors. Data are the mean ± SD (n = 3). *P < 0.05; **P < 0.01; ***P < 0.001; n. s. (not significant).

Journal: Composites Part B: Engineering

Article Title: Killing three birds with one stone: Tumor-membrane-decorated Prussian blue nanovaccines for synergistic management of skin tumors, radiation dermatitis and wounds

doi: 10.1016/j.compositesb.2023.110900

Figure Lengend Snippet: Fig. 9. Mechanistic analysis of PB nanozymes and PBVac for cancer therapy. Representative flow-cytograms and quantitative analysis of (A) CD3+CD4+ T cells and (B) CD3+CD8+ T cells in the tumors. Data are the mean ± SD (n = 3). *P < 0.05; **P < 0.01; ***P < 0.001; n. s. (not significant).

Article Snippet: Cell staining buffer and APC anti-mouse CD3 antibody (E-AB-F1013E), PE/Cyanine7 anti-mouse CD4 antibody [GK1.5] (E-AB-F1097H), and PerCP/Cyanine5.5 Anti-mouse CD8a antibody [53–6.7] (E-AB-F1104J) was provided by Elabscience Biotechnology (Wuhan, China).

Techniques:

a. Spleen weight of wild-type (WT) and Ftx KO females at 3-months, 1-year and 2-years of age. Median values are shown. ( t-test , * p -values < 0.05). Underneath, representative images of WT and Ftx KO spleens from 3-month, 1-year and 2-year-old females. b. Representative images of hematoxylin-eosin staining on sections of spleens from 1-year-old WT and Ftx KO females. Scale bar; 100 μm. c. Representative flow cytometry analysis of splenic myeloid dendritic cells (m-DC) in WT and Ftx KO 1-year-old females. On the right, percentages of splenic m-DC (CD11b + CD11c + ) and splenic plasmacytoid dendritic cells (p-DC) (CD11c + B220 + SiglecH + ) in leucocytes. Each triangle represents a mouse. Median values are shown. ( t-test , * p -values < 0.05). d. Representative flow cytometry analysis of spontaneously activated B cells (B220 + CD69 + ) (upper panels) or of spontaneously activated T cells (CD4 + CD69 + ) (lower panels) in spleen from 1-year-old WT and Ftx KO females. Percentages in leucocytes are shown on the graphs beneath. Each triangle represents a mouse. Median values are shown. ( t-test , * p -values < 0.05). e. IgG2a natural antibody levels in sera of 1-year- and 2-year-old WT or Ftx KO females measured by ELISA. Each triangle represents a mouse. Median values are shown. ( t-test , * p -values < 0.05). f. Representative flow cytometry analysis of (B220 + CD138 + ) plasma cells in the spleen of 1-year-old WT and Ftx KO females. Percentages in leucocytes are shown on the graphs beneath. Each triangle represents a mouse. Median values are shown. ( t-test , * p -values < 0.05). g. Representative flow cytometry analysis of (CD19 + B220 lo CD5 + ) natural antibody producing B1a in the peritoneal cavity (PerC) of 1-year-old WT and Ftx KO females. Percentages in leucocytes are shown on the graphs beneath. Each triangle represents a mouse. Median values are shown. ( t-test , * p -values < 0.05). h. Cytokines levels in the blood analysed with CBA assays on sera from 3-month-, 1-year-, or 2-year-old WT and Ftx KO females. Each triangle represents a mouse. Median values are shown. ( t-test , * p -values < 0.05). i. Representative flow cytometry analysis of monocyte populations including non-classical (CD11b hi CD43 lo Ly6C + ) scavenger monocytes in the spleen of 1-year-old WT and Ftx KO females. Percentages in leucocytes are shown on the graphs beneath. Each triangle represents a mouse. Median values are shown. ( t-test , * p -values < 0.05).

Journal: bioRxiv

Article Title: Altered X-chromosome inactivation predisposes to autoimmune manifestations in mice

doi: 10.1101/2023.04.20.537662

Figure Lengend Snippet: a. Spleen weight of wild-type (WT) and Ftx KO females at 3-months, 1-year and 2-years of age. Median values are shown. ( t-test , * p -values < 0.05). Underneath, representative images of WT and Ftx KO spleens from 3-month, 1-year and 2-year-old females. b. Representative images of hematoxylin-eosin staining on sections of spleens from 1-year-old WT and Ftx KO females. Scale bar; 100 μm. c. Representative flow cytometry analysis of splenic myeloid dendritic cells (m-DC) in WT and Ftx KO 1-year-old females. On the right, percentages of splenic m-DC (CD11b + CD11c + ) and splenic plasmacytoid dendritic cells (p-DC) (CD11c + B220 + SiglecH + ) in leucocytes. Each triangle represents a mouse. Median values are shown. ( t-test , * p -values < 0.05). d. Representative flow cytometry analysis of spontaneously activated B cells (B220 + CD69 + ) (upper panels) or of spontaneously activated T cells (CD4 + CD69 + ) (lower panels) in spleen from 1-year-old WT and Ftx KO females. Percentages in leucocytes are shown on the graphs beneath. Each triangle represents a mouse. Median values are shown. ( t-test , * p -values < 0.05). e. IgG2a natural antibody levels in sera of 1-year- and 2-year-old WT or Ftx KO females measured by ELISA. Each triangle represents a mouse. Median values are shown. ( t-test , * p -values < 0.05). f. Representative flow cytometry analysis of (B220 + CD138 + ) plasma cells in the spleen of 1-year-old WT and Ftx KO females. Percentages in leucocytes are shown on the graphs beneath. Each triangle represents a mouse. Median values are shown. ( t-test , * p -values < 0.05). g. Representative flow cytometry analysis of (CD19 + B220 lo CD5 + ) natural antibody producing B1a in the peritoneal cavity (PerC) of 1-year-old WT and Ftx KO females. Percentages in leucocytes are shown on the graphs beneath. Each triangle represents a mouse. Median values are shown. ( t-test , * p -values < 0.05). h. Cytokines levels in the blood analysed with CBA assays on sera from 3-month-, 1-year-, or 2-year-old WT and Ftx KO females. Each triangle represents a mouse. Median values are shown. ( t-test , * p -values < 0.05). i. Representative flow cytometry analysis of monocyte populations including non-classical (CD11b hi CD43 lo Ly6C + ) scavenger monocytes in the spleen of 1-year-old WT and Ftx KO females. Percentages in leucocytes are shown on the graphs beneath. Each triangle represents a mouse. Median values are shown. ( t-test , * p -values < 0.05).

Article Snippet: Bone marrow, spleen, blood and peritoneal cavity cells were stained using the following antibodies: CD3 PerCP-Vio770 (130-119-656, Miltenyi Biotec), CD4-APC (130-123-207, Miltenyi Biotec), CD5-APC-Vio770 (130-120-165, Miltenyi Biotec), CD8-FITC (130-118-468, Miltenyi Biotec), CD11b APC (553312, BD Pharmingen), CD11c PE-Vio770 (130-110-840, Miltenyi Biotec), CD19-FITC (557398, BD Pharmingen), CD21-APC-Vio770 (130-111-733, Miltenyi Biotec), CD23-PE-Vio770 (130-118-764, Miltenyi Biotec), CD38-PE (130-123-571, Miltenyi Biotec), CD43-PE (130-112-887, Miltenyi Biotec), CD69-PE (130-115-575, Miltenyi Biotec), CD138 PE-Vio615 (130-108-989, Miltenyi Biotec), F4/80 FITC (130-117-509, Miltenyi Biotec), Ter119 PE (130-112-909, Miltenyi Biotec), SiglecH APC-Vio770 (130-112-299, Miltenyi Biotec), B220-APC (130-110-847, Miltenyi Biotec), B220 VioBlue (130-110-851, Miltenyi Biotec), IgM-VioBlue (130-116-318, Miltenyi Biotec), IgD-PE (130-111-496, Miltenyi Biotec), GL7-PE-Cy7 (144619, BioLegend), Ly6C-FITC (130-111-915, Miltenyi Biotec) following recommendations of the manufacturers.

Techniques: Staining, Flow Cytometry, Enzyme-linked Immunosorbent Assay, Clinical Proteomics